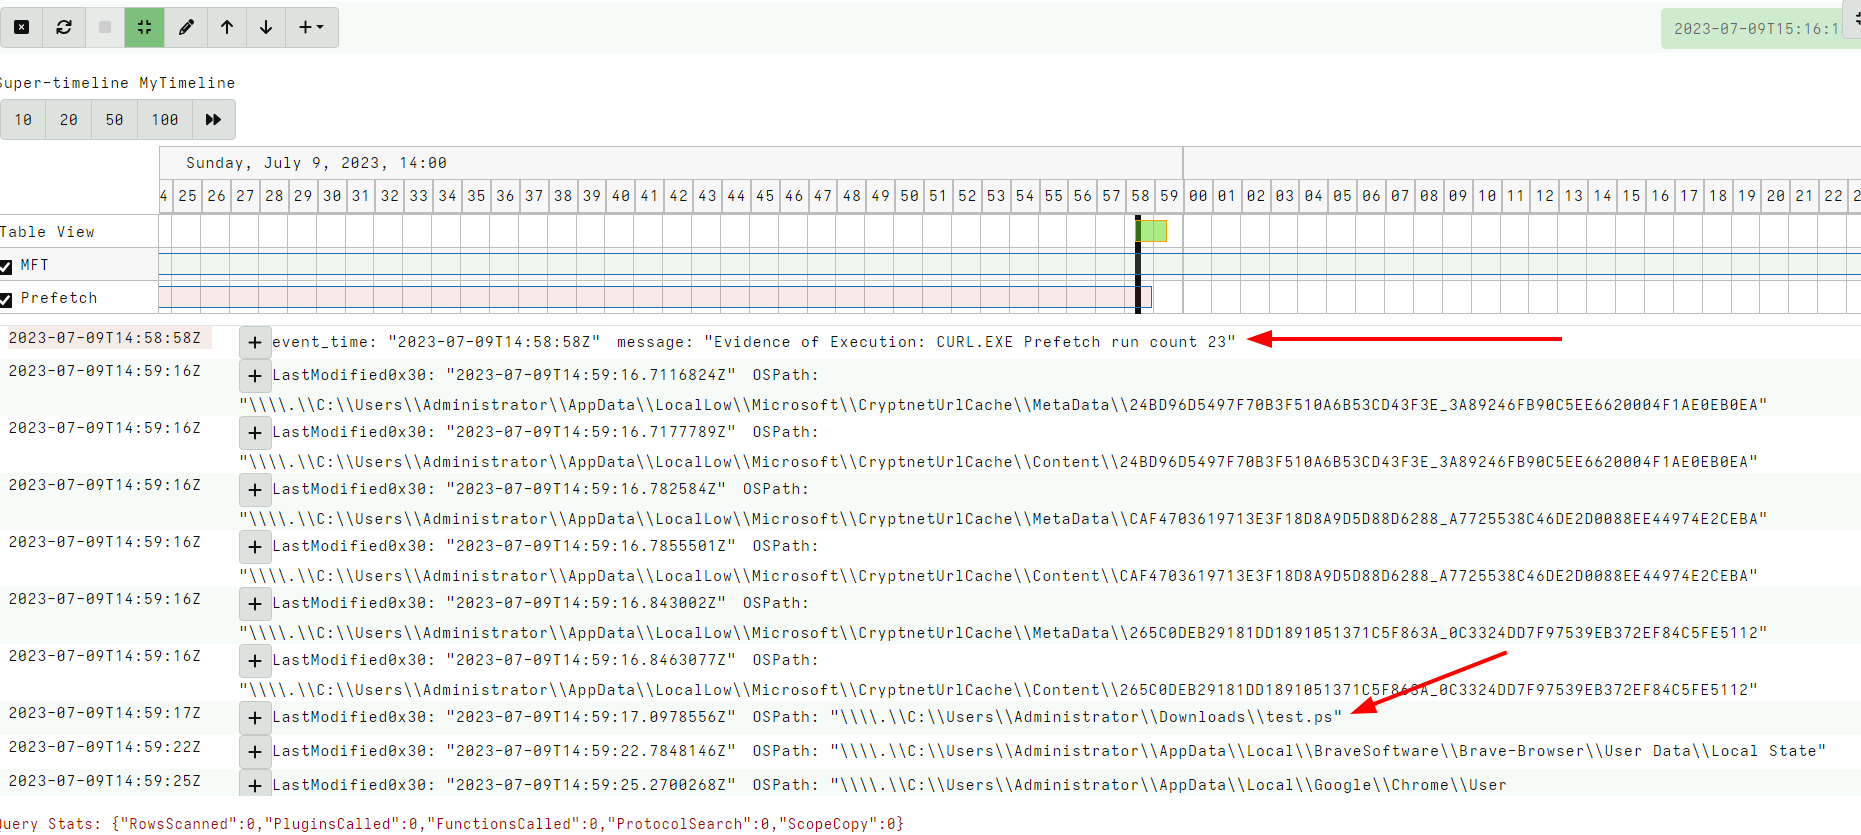
<!-- .slide: class="title" --> # Timelines ## Combining different sources of information --- <!-- .slide: class="content " --> ## What is a timeline? * It is a way to visualize time based rows from multiple sources. * The main concepts: * `Timeline`: Just a series of rows keyed on a time column. The rows can be anything at all, as long as a single column is specified as the time column and it is sorted by time order. * `Super Timeline`: A grouping of several timelines viewed together on the same timeline. --- <!-- .slide: class="content small-font" --> ## Timeline workflow * Timelines are created from post processed results from the notebook: 1. Collect a set of artifacts with relevant information: * e.g. MFT entries, Prefetch, Event logs etc. 2. Create a `Supertimeline` to hold all the timelines together. 3. Reduce the data from each artifact source by manipulating the VQL query: * Reduce the number of rows by limiting only interesting rows. * Reduce the columns by adding only important columns. 4. Add the table to the `Super Timeline` by selecting the time column. --- <!-- .slide: class="content " --> ## Example: Correlating execution with files * Run the following command: ``` curl.exe -o test.ps1 https://www.google.com/ ``` * Collect two sources of evidence: * `Windows.Timeline.Prefetch`: Collects execution times. * `Windows.NTFS.MFT`: Collects filesystem information. * For the sake of the exercise, limit times to the previous day or so. --- <!-- .slide: class="full_screen_diagram" --> ### Example: Correlating execution with files 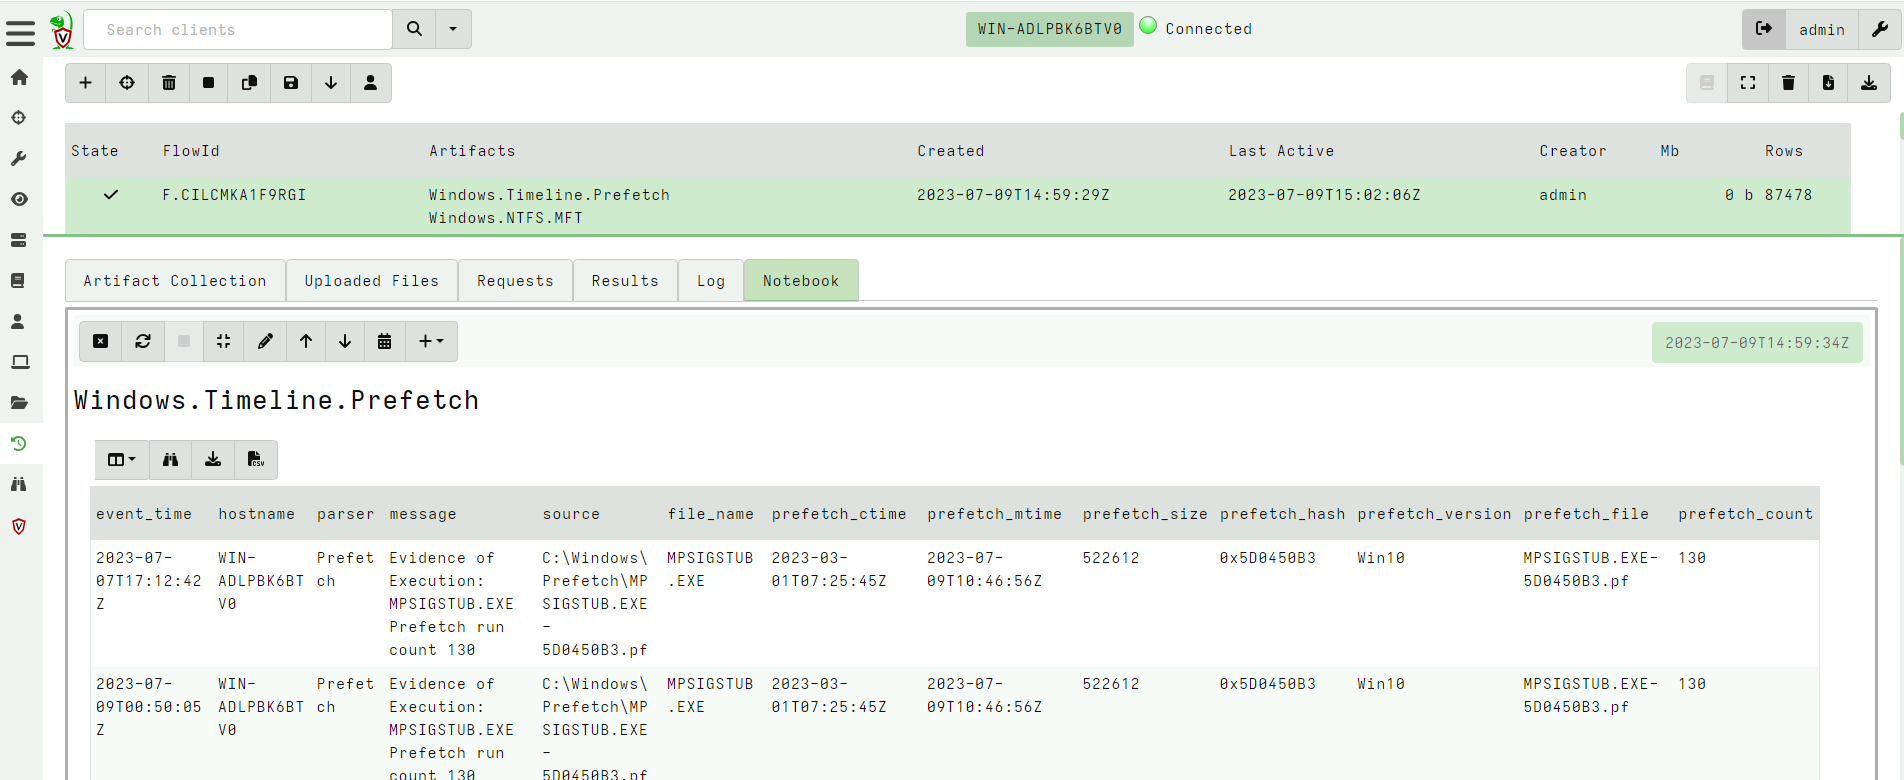 --- <!-- .slide: class="full_screen_diagram" --> ### Example: Correlating execution with files * We want to reduce the total data in each table to make it easier to see. * Usually a time column and a single other column 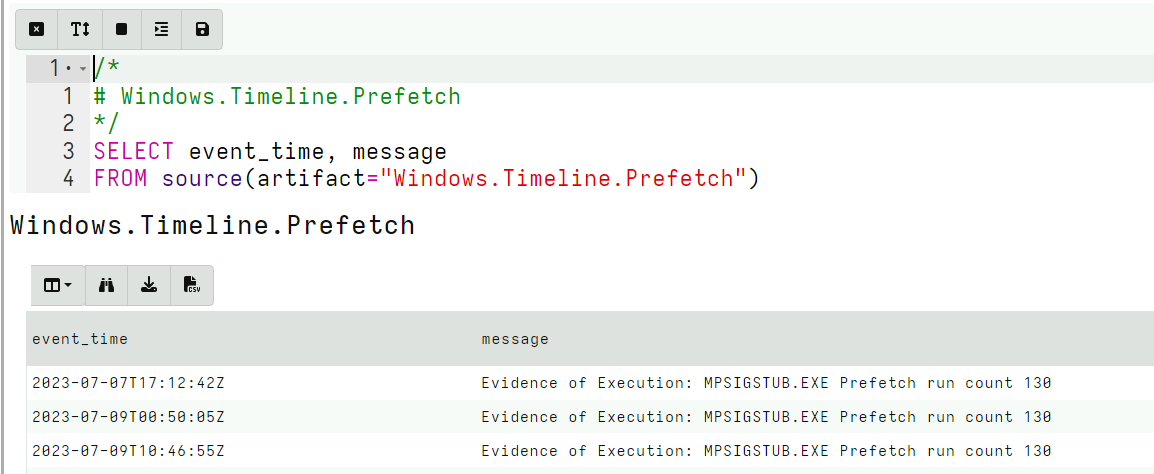 --- <!-- .slide: class="full_screen_diagram" --> ### Example: Correlating execution with files 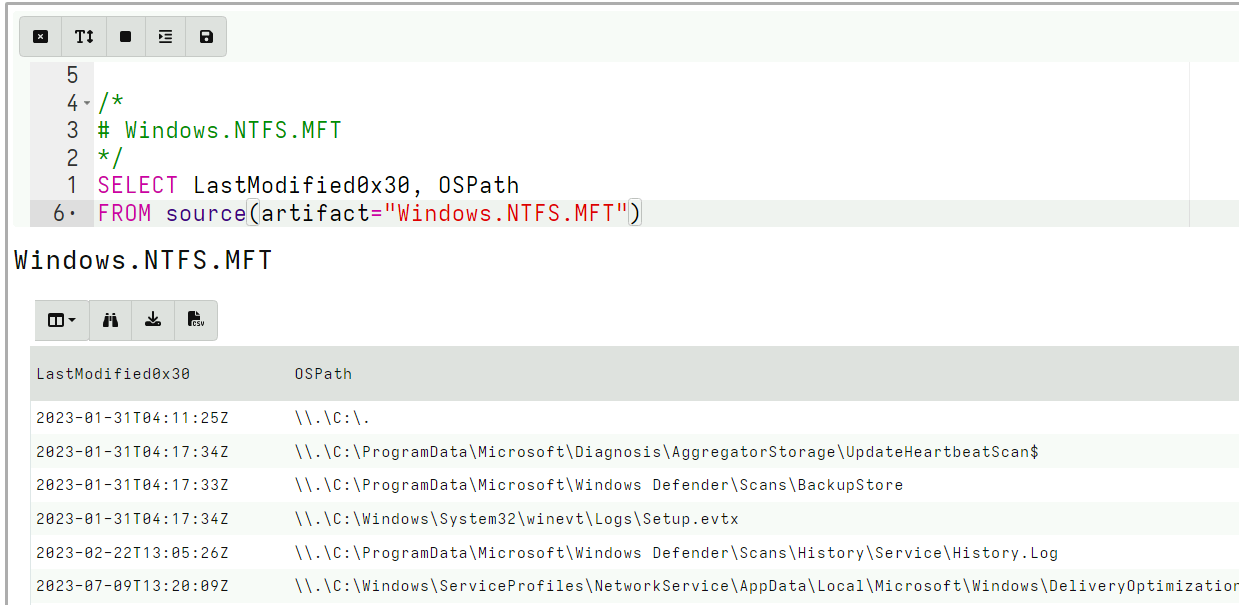 --- <!-- .slide: class="full_screen_diagram" --> ### Example: Correlating execution with files * Create a super timeline to hold the individual timelines. 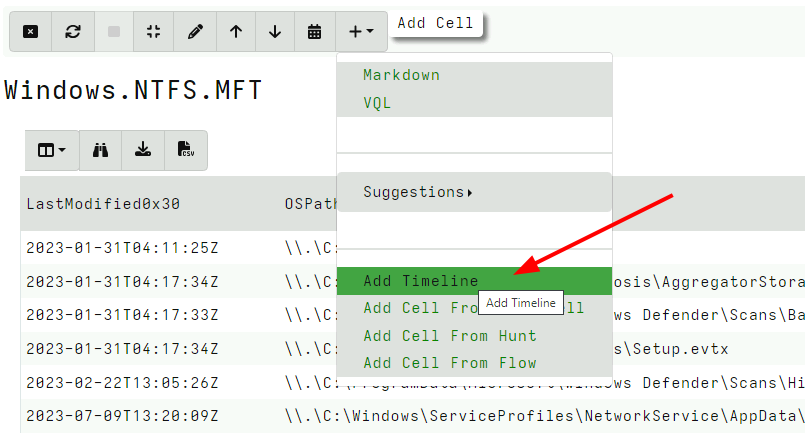 --- <!-- .slide: class="full_screen_diagram" --> ### Example: Correlating execution with files   --- <!-- .slide: class="full_screen_diagram" --> ### Example: Correlating execution with files * Investigating temporal correlation 