<!-- .slide: class="title" --> # Event queries for monitoring ## Using Event Queries for detection. --- <!-- .slide: class="content" --> ## Using Event Queries for monitoring * Velociraptor's magic sauce is the VQL language * VQL queries are asynchronous and stream results as soon as they are available * This property makes VQL ideal for watching for real time events! * In this module we learn how to apply event queries: * On the client - detection * On the server - automation
<!-- .slide: class="title" --> # Event queries and asynchronous VQL --- <!-- .slide: class="content small-font" --> ## VQL: Event Queries * Normally a VQL query returns a result set and then terminates. * However some VQL plugins can run indefinitely or for a long time. * These are called `Event VQL plugins` since they can be used to generate events. * An Event query does not complete on its own - it simply returns partial results until cancelled. --- <!-- .slide: class="content small-font" --> ## VQL: Event Queries 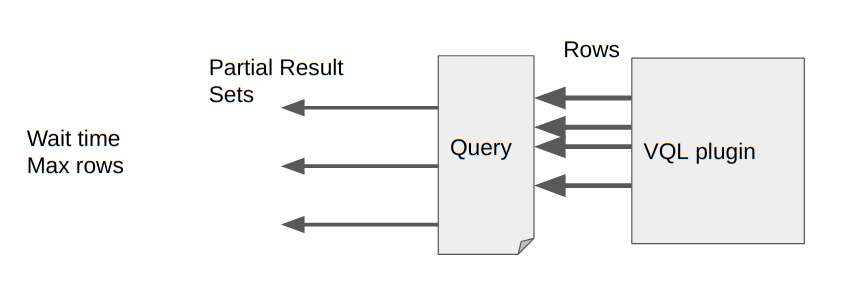 --- <!-- .slide: class="content small-font" --> ## Playing with event queries Selecting from `clock()` ``` SELECT * FROM clock() ```  Click the stop button to cancel the query. --- <!-- .slide: class="content small-font" --> ## Client monitoring architecture * The client maintains a set of VQL Event Queries * All run in parallel. * When any of these produce rows, the client streams them to the server which writes them to the filestore. * If the client is offline, these will be queued in the client’s local file buffer. --- <!-- .slide: class="full_screen_diagram" --> ## Client monitoring architecture 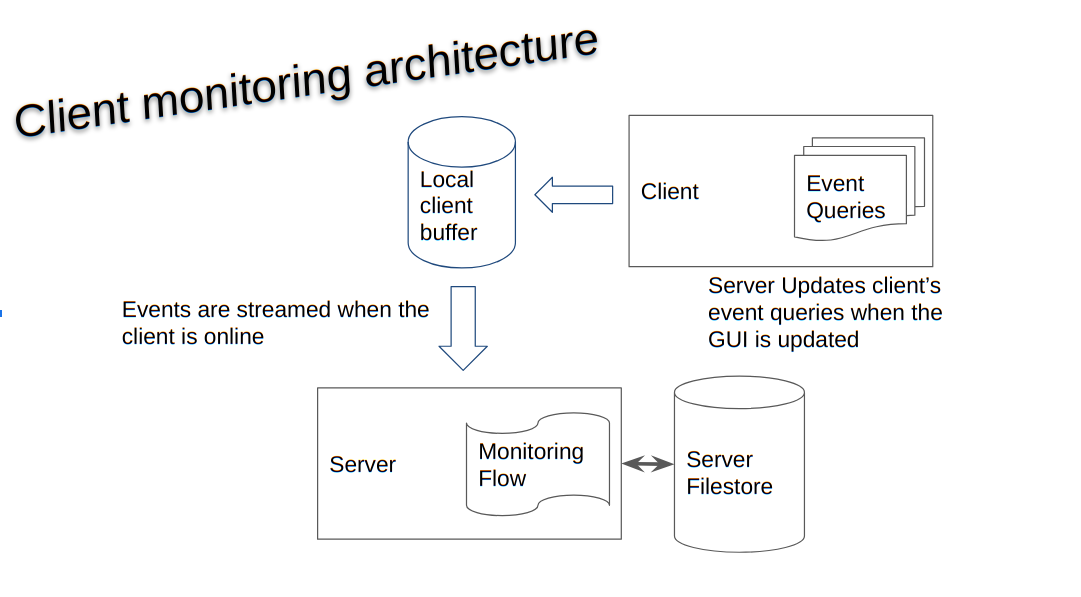 --- <!-- .slide: class="content small-font" --> ## Example event query ```sql SELECT * FROM watch_evtx(filename="C:/Windows/System32/winevt/logs/system.evtx") ``` Watch the System event log and then clear it. Wait for couple minutes. <img src="watch_evtx.png" style="width: 70%">
<!-- .slide: class="title" --> # The process tracker ## Complimenting forensic analysis with monitoring... --- <!-- .slide: class="content" --> ## What is the point of Forensics? * Forensics is used to reconstruct past events from artifacts left on the system. * We are at the mercy of lucky accidents and side effects of system behavior! * When Velociraptor is running permanently on the endpoint, we can deliberately monitor the endpoint and record a more accurate timeline of events! --- <!-- .slide: class="content" --> ## Tracking processes * One of the critical questions we ask is `Where did this process come from?` * Context of where the process came from is important in establishing initial access vector! * We could collect all process execution from all endpoints, but: * This will generate a large volume of events. * Vast majority of events are not interesting. * Often we determine which process is interesting is determined by context. --- <!-- .slide: class="content" --> ## The process tracker * Velociraptor can track processes locally on the endpoint at runtime. * If the need arises, we can enrich with process execution information. * This can be done **EVEN IF THE PROCESS EXITED** --- <!-- .slide: class="full_screen_diagram" --> ## Exercise: Enable the process tracker 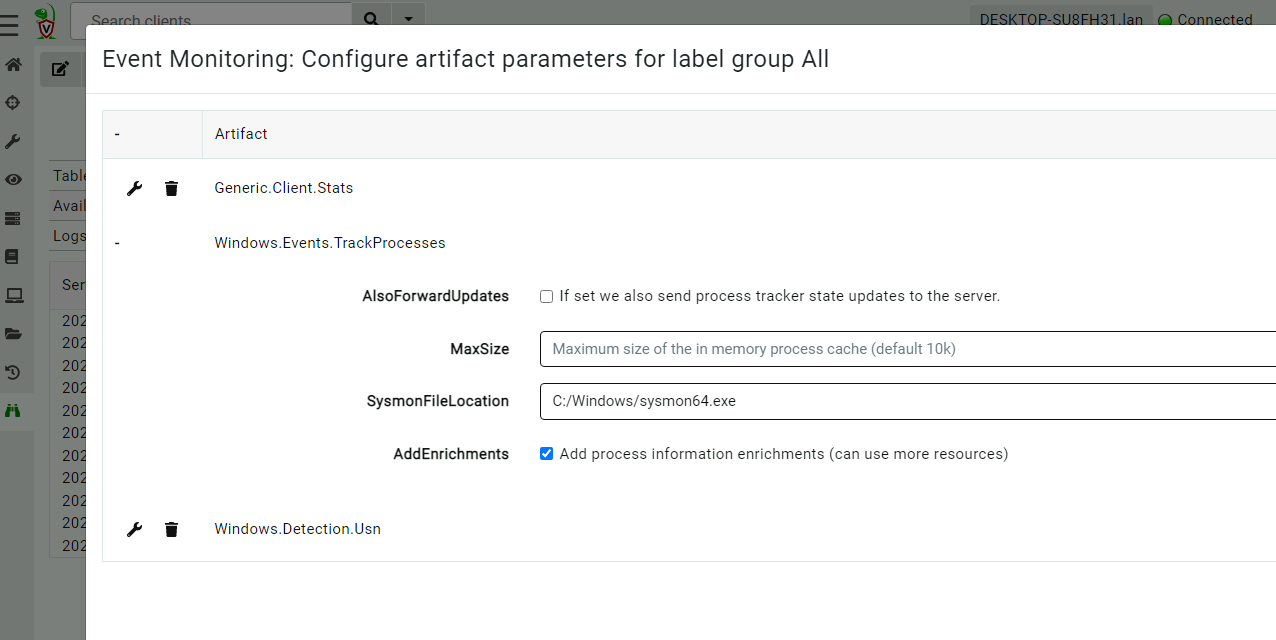 --- <!-- .slide: class="content" --> ## Emulate a typical attack ```powershell psexec.exe /s powershell ping.exe www.google.com curl.exe -o script.ps1 https://www.google.com/ notepad.exe ``` --- <!-- .slide: class="full_screen_diagram" --> ## Inspect the notepad process <img src="process_hacker.png" style="height: 600px"> --- <!-- .slide: class="content" --> ## Using Generic.System.Pstree 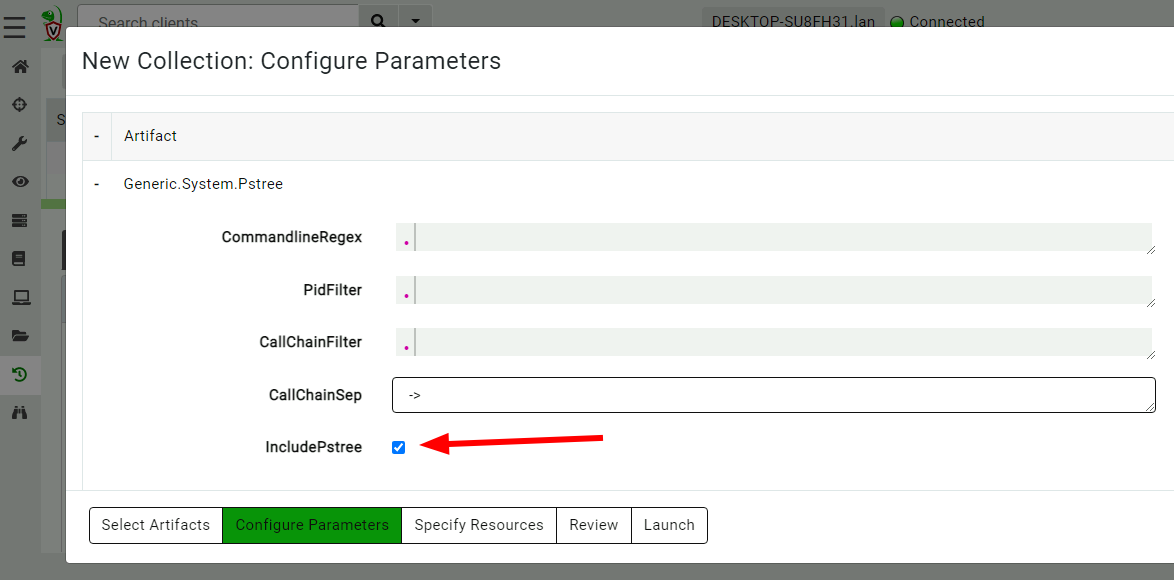 --- <!-- .slide: class="content" --> ## View process tree 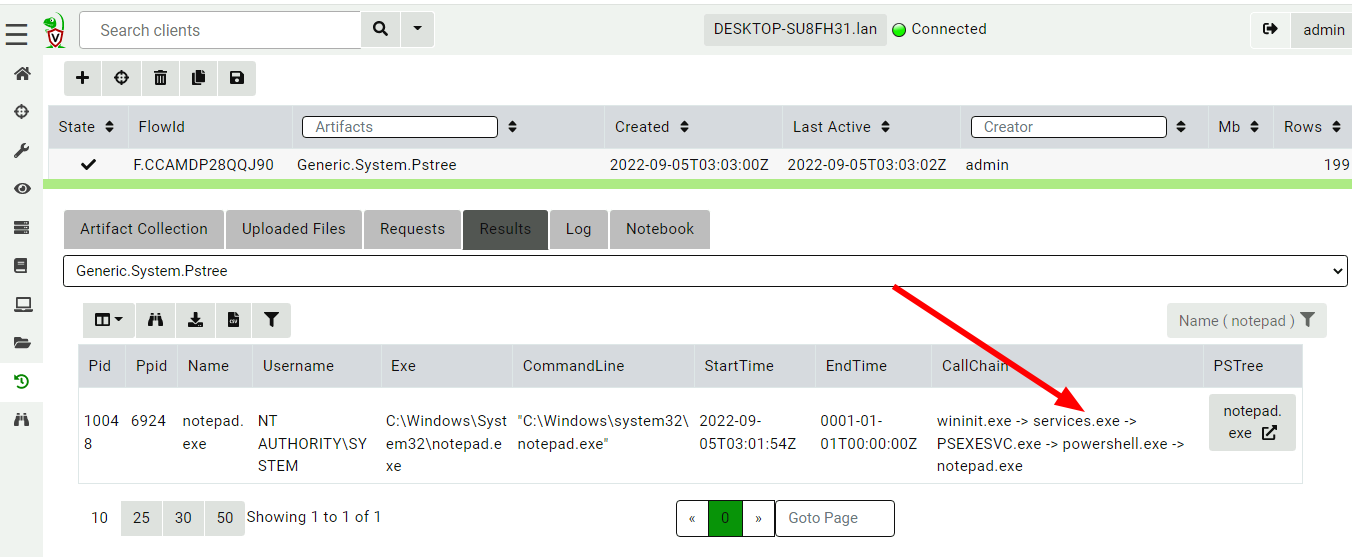 --- <!-- .slide: class="content" --> ## Inspect the process call chain 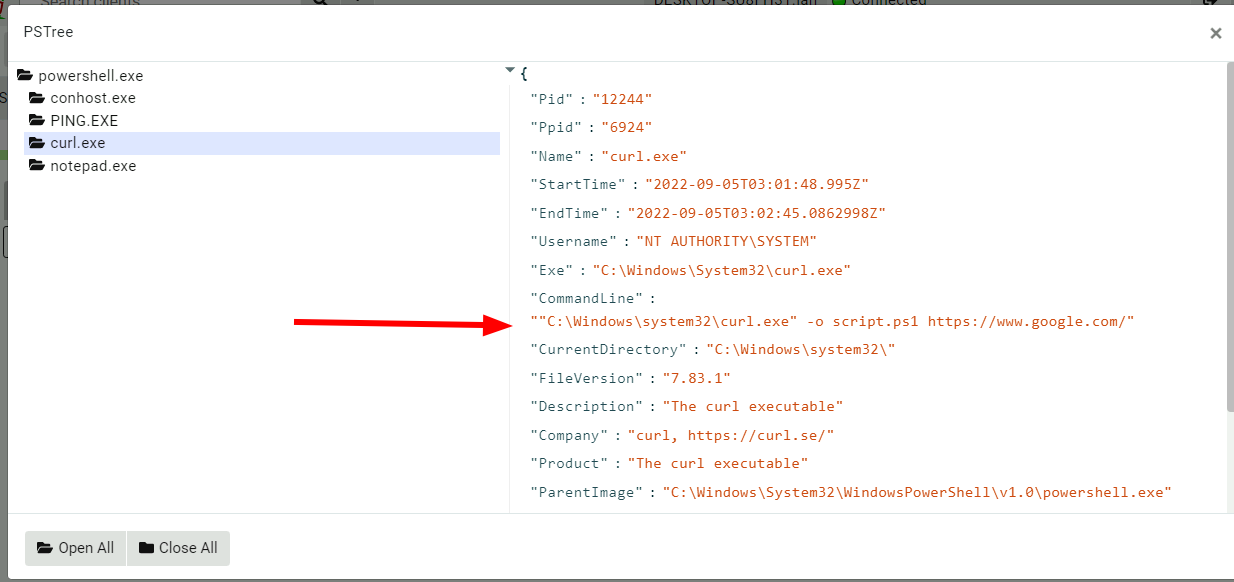
<!-- .slide: class="title" --> # Interfacing with Elastic/Kibana --- <!-- .slide: class="content" --> ## What is Elastic/Opensearch * Opensearch is a high performance text indexing system * Elastic used to be open source, but is now commercial - Opensearch is the open source equivalent. * Kibana is a GUI for Elastic. * We will not go into any details regarding Opensearch or Kibana * Only discuss how to interface Velociraptor with this. --- <!-- .slide: class="content small-font" --> ## Connection to Elastic or Opensearch * Velociraptor offers Elastic/Opensearch or Splunk bulk uploaders. * Simple Bulk upload API clients - just push data upstream. * We currently do not offer a way to query the data in VQL - only upload it. * The `Elastic.Flows.Upload` artifact works by installing a server event monitoring query: * Watch for `System.Flow.Completion` events * Get all the data for each artifact query and upload to elastic index * Each artifact source receives its own index. * Indexes are automatically created --- <!-- .slide: class="content small-font" --> ## Installing ELK * A lot of tutorials online about installing ELK * For the sake of this exercise, I will have elastic and kibana listening on localhost only. Real installs are more complex. * Install Java for Windows: https://www.oracle.com/au/java/technologies/downloads * Download Elastic ZIP for windows: https://www.elastic.co/downloads/elasticsearch * Unzip Elastic and start it using `bin\elasticsearch.bat` * Reset password with * `elasticsearch-reset-password.bat -i -u elastic` * Optionally install `Kibana` if you want but we wont be using it. --- <!-- .slide: class="content" --> ## Interacting with Opensearch * Elastic/Opensearch has a REST API which can be accessed with `curl.exe` * To test if the cluster is up, simply issue a GET request. * `curl.exe -X GET -u elastic:password -k https://localhost:9200/` * In a real environment connections will be secured with HTTPS and include credentials. --- <!-- .slide: class="content small-font" --> ## Interacting with Opensearch * Reference for REST API is https://www.elastic.co/guide/en/elasticsearch/reference/current/cat.html <img src="testing_elastic_install.png" > --- <!-- .slide: class="full_screen_diagram" --> ### Installing the uploader 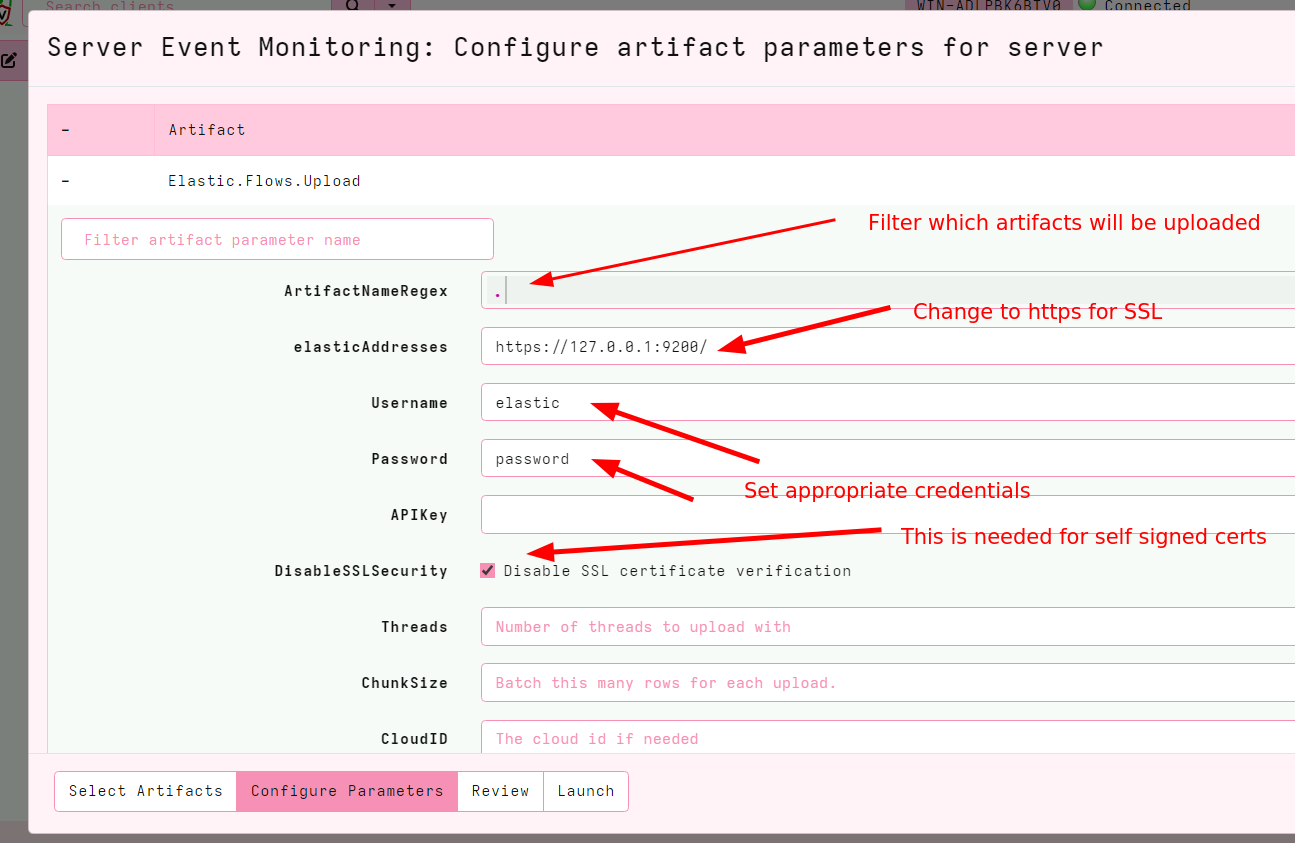 --- <!-- .slide: class="full_screen_diagram" --> ### Verifying the Uploader works 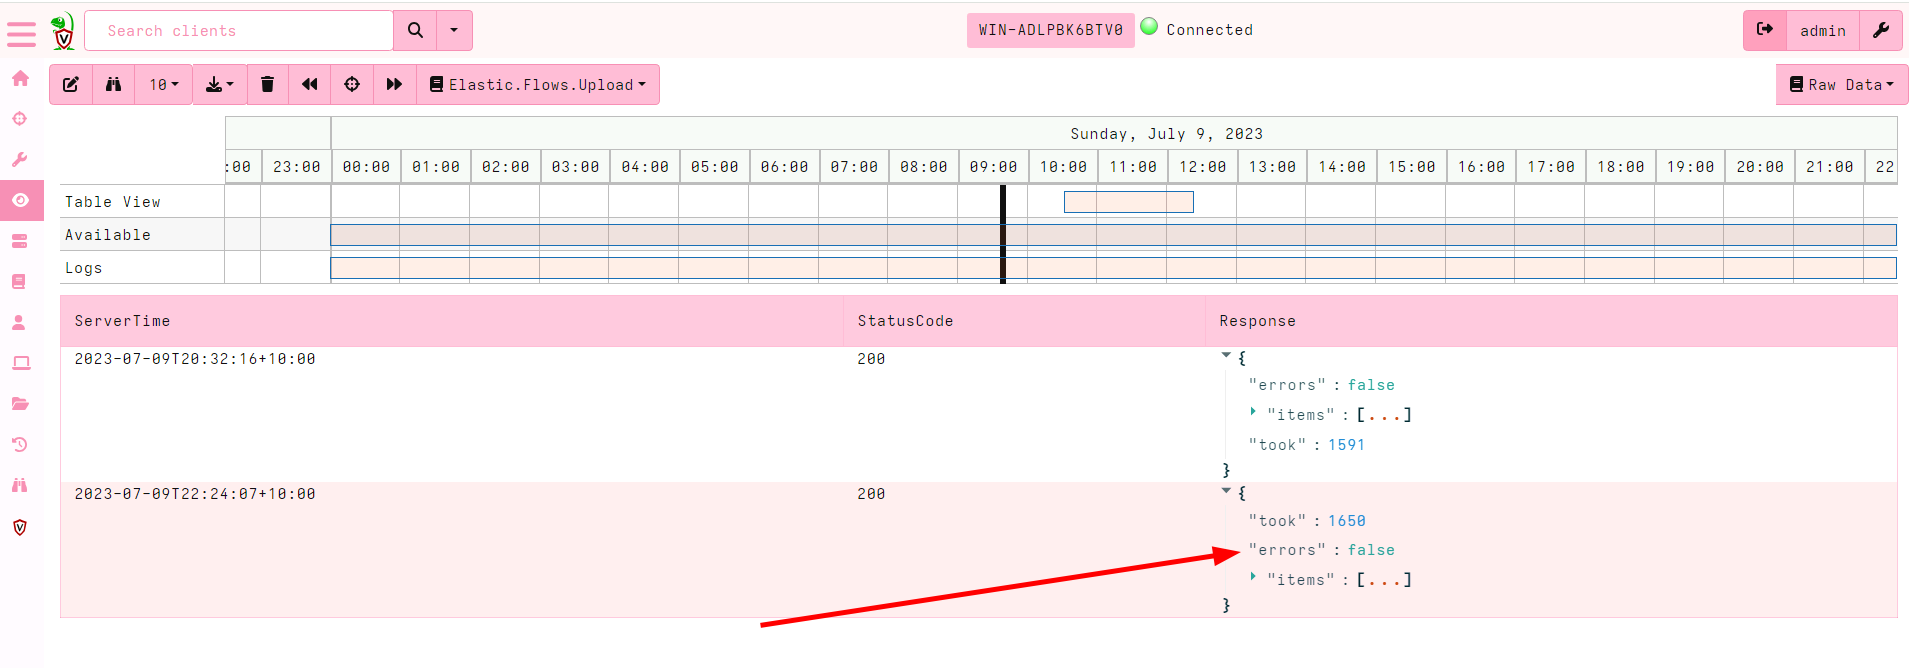 --- <!-- .slide: class="content" --> ## Check for new indexes * The `Elastic.Flows.Upload` artifact pushes data to indices named after the artifact name. * By default Elastic automatically creates the index schema. * This is not ideal because the index will be created based on the first row. * If the first row is different from the rest the index will be created with the wrong schema! * This is why it is important to keep your artifacts consistent! always return the same rows even if null. --- <!-- .slide: class="content small-font" --> ## Verify that indexes are populated ``` curl.exe -u elastic:password -k https://localhost:9200/_cat/indices curl.exe -u elastic:password -k https://localhost:9200/artifact_generic_client_info_users/_search ```  --- <!-- .slide: class="content" --> ## You can clear indices when you want You can use the Elastic documentation to manipulate the Elastic server https://www.elastic.co/guide/en/elasticsearch/reference/current/indices-delete-index.html ``` curl.exe -u elastic:password -k -X DELETE "https://localhost:9200/artifact_generic_client_info_users ``` --- <!-- .slide: class="content" --> ## Exercise: Create and maintain Elastic index * The `Elastic.Flows.Upload` artifact is just an example of an elastic artifact. * We can maintain any kind of elastic index * For this exercise, create and maintain an index of all known clients * Update this index every hour. --- <!-- .slide: class="content small-font" --> ## Exercise: Create and maintain Elastic index <div class="solution solution-closed"> ``` SELECT * FROM elastic_upload( addresses="https://127.0.0.1:9200/", skip_verify=TRUE, index="clients", username="elastic", password="password", query={ SELECT * FROM foreach(row={ SELECT * FROM clock(period=3600, start=0) }, query={ SELECT client_id, os_info.hostname AS Hostname FROM clients() }) }) ``` </div>
<!-- .slide: class="title" --> # Alerting and Escalation --- <!-- .slide: class="content" --> ## Integration with Slack/Discord * Many systems allow interactions through a REST API * This is basically HTTP requests. * We can use the `http_client()` plugin to make web request. * https://support.discord.com/hc/en-us/articles/228383668-Intro-to-Webhooks --- <!-- .slide: class="content" --> ## Integration with Slack/Discord 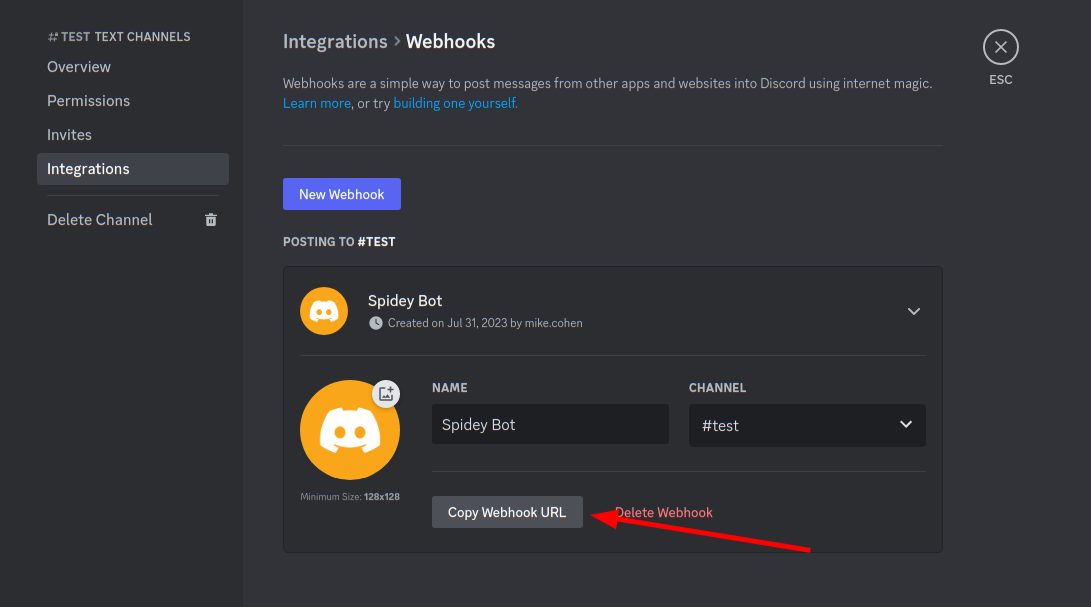 --- <!-- .slide: class="content small-font" --> ## Sending a message to a discord channel * Use `http_client()` to POST the request to the webhook. * More information https://birdie0.github.io/discord-webhooks-guide/structure/content.html ```sql LET DiscordURL = "https://discord.com/api/webhooks/1135479909406490736/8272quOa1IEh4GV1IJDbvEmGbXKQQl7PUnvb92ZJDqwUFGa8X9LF0gh_0DSKl8t1p7VC" SELECT * FROM http_client( url=DiscordURL, method="POST", headers=dict(`Content-Type`="application/json"), data=serialize( format="json", item=dict(content="Hello World!"))) ``` --- <!-- .slide: class="content" --> ## Sending a message to a discord channel  --- <!-- .slide: class="content" --> ## Exercise: Alert discord when a new hunt is created * Write an artifact to forward alerts to a discord channel when a hunt is created. * Your instructor will create and share a webhook URL * What other events can your webhook trigger on? --- <!-- .slide: class="content" --> ## The Alerting framework * Velociraptor server event artifacts can trigger on any event from the client or the server. * But we have to name the actual event - this makes it hard to watch many events at the same time. * When watching a client event we need to name the client id - this does not scale to many clients. --- <!-- .slide: class="content" --> ## The Alerting framework * Velociraptor has a generic event queue `Server.Internal.Alerts` * When any artifact uses the `alert()` VQL function, the message is routed to this queue * The `alert()` function accepts a structured message * Alerts are supposed to be low volume pointers that more review is needed. There are deduplicated heavily. * Alerting can be done on the client in any artifact - including normal collections. --- <!-- .slide: class="content" --> ## Exercise: Forwarding alerts to Discord * Write an artifact to forward alerts to a discord channel. * Add alerting capabilities to other artifacts: * Alert when a process listing is found with the `psexec` process * Create an alert with a link back to the Velociraptor console to view the collection. --- <!-- .slide: class="content" --> ## Other integrations * Using `http_client()` allows VQL to interface with many external REST based system: * Slack integration [Server.Slack.Clients.Enrolled](https://docs.velociraptor.app/exchange/artifacts/pages/server.slack.clients.enrolled/) * Telegram [Server.Telegram.Clients.Enrolled](https://docs.velociraptor.app/exchange/artifacts/pages/server.telegram.clients.enrolled/) * IRIS [Server.Alerts.Monitor.IRIS](https://docs.velociraptor.app/exchange/artifacts/pages/server.alerts.monitor.iris/) * VirusTotal [Server.Enrichment.Virustotal.FileScan](https://docs.velociraptor.app/exchange/artifacts/pages/server.enrichment.virustotal.filescan/) * If you have a lot of requests to make use `foreach()` with large number of workers.
<!-- .slide: class="title" --> # Server Automation With Event Queries --- <!-- .slide: class="content" --> ## Server Automation With Event Queries * It is possible to automate things based on server side events. * When collections complete they emit `System.Flow.Completion` which can be watched using the `watch_monitoring()` plugin. --- <!-- .slide: class="content" --> ## Exercise: Automatically archive Windows.KapeFiles.Targets * When the user collects a `Windows.KapeFiles.Targets` artifact, zip the collection up (with [create_flow_download](https://docs.velociraptor.app/vql_reference/server/create_flow_download/)) and archive it into a directory --- <!-- .slide: class="content" --> ## Exercise: Import offline collections * Write an artifact that will automatically import any new offline collection thatt appear in a directory. * Also add the collections to a running hunt.
<!-- .slide: class="content" --> ## Review And Summary * Event queries never terminate! Instead they stream results in real time. * Event queries on the endpoint can be used for monitoring and detection. * Event queries on the server can be used for automation --- <!-- .slide: class="content" --> ## Review And Summary * Velociraptor's process tracker is used on the end point to enrich process information with context that is critical for understanding where a process came from.